![\includegraphics[scale=0.6]{tcl_main.eps}](img877.gif) The interface is started by typing astra.tcl which brings up the window shown in
figure 4.27. If this does not work it may be necessary to change the first line in the
astra.tcl file to point to the correct location of the wish interpreter (note that very old
versions of wish may not work correctly). The first of the three yellow buttons enables the setting
up of the cylinder geometry within which the
cloud is to be defined as well as the number of lines of sight that are to be used. The second
yellow button enables the cloud parameters to be defined and the third button is the interface to
previous runs. Pressing the green
The interface is started by typing astra.tcl which brings up the window shown in
figure 4.27. If this does not work it may be necessary to change the first line in the
astra.tcl file to point to the correct location of the wish interpreter (note that very old
versions of wish may not work correctly). The first of the three yellow buttons enables the setting
up of the cylinder geometry within which the
cloud is to be defined as well as the number of lines of sight that are to be used. The second
yellow button enables the cloud parameters to be defined and the third button is the interface to
previous runs. Pressing the green
An Option to Save the Run
[l]
![\includegraphics[scale=0.5]{tcl_saverun.eps}](img880.gif) Once ASTRA is started a small window will almost immediately be displayed (as in
figure 4.28) giving the option to save the run. If there is no intention to save
the run the the
Once ASTRA is started a small window will almost immediately be displayed (as in
figure 4.28) giving the option to save the run. If there is no intention to save
the run the the
![]() button can be pressed straight away. However, if the run is to be
saved then the
button can be pressed straight away. However, if the run is to be
saved then the
![]() button should only be pressed when ASTRA has finished (this is
because pressing the button starts to transfer files which are only complete when ASTRA is
finished). Finally, on the main window there is also a blue
button should only be pressed when ASTRA has finished (this is
because pressing the button starts to transfer files which are only complete when ASTRA is
finished). Finally, on the main window there is also a blue
![]() button which has no effect other
than to kill off the Tcl windows (ie. all other files are left as they were).
button which has no effect other
than to kill off the Tcl windows (ie. all other files are left as they were).
Dealing with each of the three yellow buttons on the main interface in turn:
![\includegraphics[scale=0.5]{tcl_ringgeom.eps}](img884.gif)
Method of distributing cylinders/disks in the cloud
[l]
![\includegraphics[scale=0.6]{cyldist.eps}](img885.gif) The ring geometry window consists of a top and side view display of the selected cloud, and panel
on the right which enables the cylinder parameters to be altered. At the bottom is a statistics
line which gives an idea of the size of the model being requested by listing the number of
rings that will be in the cloud and the total number of lines of sight that will need to be
calculated (this is simply the number of rings in the cloud multiplied by the number of lines of
sight per ring). The parameters to be entered on the right are the number of cylinders and disks
required for the model (note that for an even distribution there should be twice the number of
disks as there are cylinders since the cylinders count from the centre and therefore cover only half
the width of the cloud whereas the disks cover the entire height of the cloud). The
value
The ring geometry window consists of a top and side view display of the selected cloud, and panel
on the right which enables the cylinder parameters to be altered. At the bottom is a statistics
line which gives an idea of the size of the model being requested by listing the number of
rings that will be in the cloud and the total number of lines of sight that will need to be
calculated (this is simply the number of rings in the cloud multiplied by the number of lines of
sight per ring). The parameters to be entered on the right are the number of cylinders and disks
required for the model (note that for an even distribution there should be twice the number of
disks as there are cylinders since the cylinders count from the centre and therefore cover only half
the width of the cloud whereas the disks cover the entire height of the cloud). The
value ![]() (described in section 4.5.3) is a measure of the number of lines
of sight. It must be a factor of four so a pulldown menu is provided with the first few possible
options - although larger values are possible (this would entail only a simple modification to Tcl
script) they will dramatically increase the run times. The next two pull down menus alter the
distribution of the cylinders and disks throughout the cloud. The menus are simply labelled
(described in section 4.5.3) is a measure of the number of lines
of sight. It must be a factor of four so a pulldown menu is provided with the first few possible
options - although larger values are possible (this would entail only a simple modification to Tcl
script) they will dramatically increase the run times. The next two pull down menus alter the
distribution of the cylinders and disks throughout the cloud. The menus are simply labelled ![]() ,
,
![]() ,
etc.; these
define the function
,
etc.; these
define the function ![]() .
The cylinders and disks are then distributed according to
.
The cylinders and disks are then distributed according to
![\includegraphics[scale=0.5]{tcl_paramset.eps}](img899.gif)
The parameter selection window shows a table of the presently selected parameter (this defaults to
the relative molecular abundance at startup) at each disk and cylinder intersection. The pulldown
menu at the centre bottom of the window changes the parameter shown. If desired the individual
entries can be altered by hand. On startup the values are calculated using the formula displayed at
the bottom. If the numbers are to be updated using this formula then the
![]() button
should be pressed.
button
should be pressed.
Adding an outflow
[l]
![\includegraphics[scale=0.5]{tcl_outflow.eps}](img901.gif) To facilitate modelling outflows a simple model of an
outflow can be added. Pressing the
To facilitate modelling outflows a simple model of an
outflow can be added. Pressing the
![]() button brings up the window shown in figure 4.32. This adds onto the
already defined model parameters an outflow defined as shown in figure 4.33. Simply enter
the required values and press
button brings up the window shown in figure 4.32. This adds onto the
already defined model parameters an outflow defined as shown in figure 4.33. Simply enter
the required values and press
![]() .
Selecting the
.
Selecting the
![]() button destroys the window and
ignores any
values that may have been entered. This outflow model is not in any way intended to be sophisticated but
is only an attempt to provide a first approximation for an outflow. The individual fields for each
parameter can of course be altered individually by hand if minor variations are required - otherwise for
more major variations the outflow.f program can be substituted for a more complex version - this can be
done without affecting the rest of the program.
button destroys the window and
ignores any
values that may have been entered. This outflow model is not in any way intended to be sophisticated but
is only an attempt to provide a first approximation for an outflow. The individual fields for each
parameter can of course be altered individually by hand if minor variations are required - otherwise for
more major variations the outflow.f program can be substituted for a more complex version - this can be
done without affecting the rest of the program.
Outflow definition
[r]
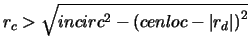
![\includegraphics[scale=0.5]{outflow.eps}](img904.gif) As shown in Figure 4.33 the inner and outer walls of the outflow are described by two
concentric hemispheres of radius
As shown in Figure 4.33 the inner and outer walls of the outflow are described by two
concentric hemispheres of radius ![]() and
and ![]() closer to the centre of the cloud than
closer to the centre of the cloud than
![]() .
Further out from
the centre of the cloud than the value given for `centre location' (hereafter
.
Further out from
the centre of the cloud than the value given for `centre location' (hereafter ![]() )
the outflow is
considered to be
parallel to the cylinders. Outflow only takes place within the cylinder bounded by
)
the outflow is
considered to be
parallel to the cylinders. Outflow only takes place within the cylinder bounded by ![]() and
and
![]() .
Note the restriction imposed by the general requirement for 2-D symmetry - ie. that the
outflow has to be perpendicular to the disks in the model. This means that (for example) when
modelling a rotating disk with a bipolar outflow that the outflow has to be perpendicular to the
disk. This restriction can only be overcome by conversion to a fully 3-D model. The outflow has a
velocity
.
Note the restriction imposed by the general requirement for 2-D symmetry - ie. that the
outflow has to be perpendicular to the disks in the model. This means that (for example) when
modelling a rotating disk with a bipolar outflow that the outflow has to be perpendicular to the
disk. This restriction can only be overcome by conversion to a fully 3-D model. The outflow has a
velocity ![]() where
where ![]() is entered in the `Speed' entry and the value of
is entered in the `Speed' entry and the value of ![]() is entered in the
`Drop off' entry.
is entered in the
`Drop off' entry. ![]() is the distance from the cloud centre so, for example, a value of
is the distance from the cloud centre so, for example, a value of ![]() means
the speed drops off linearly with distance from the cloud centre. The material in the outflow is assumed
to `form' along the piece of the cloud axis that passes between the two hemispheres (this is shown by a
slightly thicker section of line in figure 4.34). The amount of material flowing out
down the outflow per unit time is constant and is entered in the `mass per second' field (hereafter
means
the speed drops off linearly with distance from the cloud centre. The material in the outflow is assumed
to `form' along the piece of the cloud axis that passes between the two hemispheres (this is shown by a
slightly thicker section of line in figure 4.34). The amount of material flowing out
down the outflow per unit time is constant and is entered in the `mass per second' field (hereafter
![]() ).
).
Once all the parameters have been entered and the
![]() button pressed the fortran program
`outflow.f' is started. This does the actual modification of the input files. It does this by
considering all the intersections of disks and cylinders in turn so see if they are within the outflow
or not. If the particular intersection being looked at is within the outflow then the outflow
parameters at that point are calculated and added to the existing parameters at that point. As an example
consider the intersection of a disk with co-ordinate
button pressed the fortran program
`outflow.f' is started. This does the actual modification of the input files. It does this by
considering all the intersections of disks and cylinders in turn so see if they are within the outflow
or not. If the particular intersection being looked at is within the outflow then the outflow
parameters at that point are calculated and added to the existing parameters at that point. As an example
consider the intersection of a disk with co-ordinate ![]() and a cylinder with
co-ordinate
and a cylinder with
co-ordinate ![]() .
The program first checks to see if
.
The program first checks to see if
![]() and that
and that
![]() .
If these are true then the intersection lies in the region where the outflow is parallel to the
cylinders.
.
If these are true then the intersection lies in the region where the outflow is parallel to the
cylinders.
For the region where the outflow is changing direction consider the triangles shown in
figure 4.35 (the dashed line represents a disk at position ![]() ).
First note that the lengths of the sides are related to the parameters
entered by:
).
First note that the lengths of the sides are related to the parameters
entered by:
 then it lies outside the
inner edge of the outflow. Therefore, if both these criteria are satisfied the intersection lies within
the outflow. For those points within the outflow the hydrogen density is calculated and the velocity
(radial and vertical).
then it lies outside the
inner edge of the outflow. Therefore, if both these criteria are satisfied the intersection lies within
the outflow. For those points within the outflow the hydrogen density is calculated and the velocity
(radial and vertical).
![\includegraphics[scale=0.5]{tcl_select.eps}](img922.gif)
The window for selecting from older stored runs consists of a section on the left listing the numbers
of all runs that have been stored. Next to each number is a comment which is entered when the run is saved.
Although up to 10 lines of comments can be entered per run only the first line is displayed here. The right half of the window then lists some of the more
important parameters of the model selected (as default at start up the model selected is the last
one saved). At the same time a GKS window will appear displaying the output from that run. Double
clicking on the number for one of the previous runs will adopt the parameters from that run as those displayed in the
right of the window and the output from that run will be displayed in the GKS window. The
![]() button
will delete all the files associated with the currently selected run. The list is re-read by pressing the
button
will delete all the files associated with the currently selected run. The list is re-read by pressing the
![]() button which is necessary if new files have been calculated as they are not automatically
added to the list.
Only those parameters surrounded by depressed boxes can be altered in this window - the others can be
altered only in other windows (eg. the cloud radius, ring numbers, etc. are altered in the already
described section for setting up ring geometries (next to figure 4.31)). To alter the
transitions that are to be output (and the
positions at which they are to be output) press the
button which is necessary if new files have been calculated as they are not automatically
added to the list.
Only those parameters surrounded by depressed boxes can be altered in this window - the others can be
altered only in other windows (eg. the cloud radius, ring numbers, etc. are altered in the already
described section for setting up ring geometries (next to figure 4.31)). To alter the
transitions that are to be output (and the
positions at which they are to be output) press the
![]() button. This brings up the
window shown in figure 4.37. A maximum of 5 transitions can be chosen and for each
transition output can be generated at up to 6 positions. If the entries for the upper and lower
transitions are the same (ie.
button. This brings up the
window shown in figure 4.37. A maximum of 5 transitions can be chosen and for each
transition output can be generated at up to 6 positions. If the entries for the upper and lower
transitions are the same (ie.
![]() )
then that line is ignored. If a line has a valid
transition then the number of non-zero pairs of co-ordinates plus one is taken to be the number of output
positions (ie. the (0,0) position is always output) unless all co-ordinate positions are zero in which
case it is assumed that just one output is
required at the (0,0) position.
)
then that line is ignored. If a line has a valid
transition then the number of non-zero pairs of co-ordinates plus one is taken to be the number of output
positions (ie. the (0,0) position is always output) unless all co-ordinate positions are zero in which
case it is assumed that just one output is
required at the (0,0) position.
Hardcopy
[l]
![\includegraphics[scale=0.15]{tcl_hardcopy.eps}](img928.gif) If a hardcopy of the selected model output is required then press the
If a hardcopy of the selected model output is required then press the
![]() button.
This
brings up the window shown in figure 4.38 which has one pull down menu.
Selecting `xw' (the default) prints to the Xwindow, `ps_l'
produces a landscape postscript page and `ps_p' a portrait postscript page. The final choice of
`epsf_p' (for encapsulated postscript) brings up another window (shown in
figure 4.39) that is used to enter the required dimensions for the epsf output.
Selecting epsf size
[r]
button.
This
brings up the window shown in figure 4.38 which has one pull down menu.
Selecting `xw' (the default) prints to the Xwindow, `ps_l'
produces a landscape postscript page and `ps_p' a portrait postscript page. The final choice of
`epsf_p' (for encapsulated postscript) brings up another window (shown in
figure 4.39) that is used to enter the required dimensions for the epsf output.
Selecting epsf size
[r]
![\includegraphics[scale=0.3]{tcl_hardepsf.eps}](img930.gif) Once the required output has been selected press the
Once the required output has been selected press the
![]() button. This prints the
postscript
file to disk (except for the `xw' option which only draws on the screen). Once the postscript file has
been written to disk a button appears giving the option to send this file to the printer. Note that this works
simply by issuing the command 'lp gks74.ps' so in order for this to work the PGPLOT interface must write
postscript file to this file name. This will only occur if the file does not already exist so the program
first issues the command `rm gks74.ps'. This of course deletes any file that may previously have existed under
this name.
button. This prints the
postscript
file to disk (except for the `xw' option which only draws on the screen). Once the postscript file has
been written to disk a button appears giving the option to send this file to the printer. Note that this works
simply by issuing the command 'lp gks74.ps' so in order for this to work the PGPLOT interface must write
postscript file to this file name. This will only occur if the file does not already exist so the program
first issues the command `rm gks74.ps'. This of course deletes any file that may previously have existed under
this name.
Draw a position velocity diagram
[l]
![\includegraphics[scale=0.15]{tcl_map.eps}](img932.gif) For runs where output was generated for a cut across the cloud a position velocity diagram can be generated by
pressing the
For runs where output was generated for a cut across the cloud a position velocity diagram can be generated by
pressing the
![]() button which brings up figure 4.40. Here it is simply necessary to
select the transition for which the p-v diagram is required and select the type of output required (this
operates in the same way as the hardcopy generation described above). This then calls the posvel.f program
which actually produces the position velocity diagram and displays it either on the screen or saves it as an
eps file.
button which brings up figure 4.40. Here it is simply necessary to
select the transition for which the p-v diagram is required and select the type of output required (this
operates in the same way as the hardcopy generation described above). This then calls the posvel.f program
which actually produces the position velocity diagram and displays it either on the screen or saves it as an
eps file.
Produce a grid spectra map
[l]
![\includegraphics[scale=0.33]{tcl_grid.eps}](img934.gif) The final option is to produce a grid spectra map. This is done by pressing the
The final option is to produce a grid spectra map. This is done by pressing the
![]() button
which brings up figure 4.41. There are two options here, represented by the
button
which brings up figure 4.41. There are two options here, represented by the
![]() and
and
![]() buttons. Max mode detects the extreme positions for which
buttons. Max mode detects the extreme positions for which
model data was calculated and
produces a grid map that exactly fits these positions (note that the calculated positions must be evenly
spaced and must match the value entered in the grid spacing box). Custom mode allows the user to define the size of the grid by giving in the left and bottom
edge co-ordinates and then entering the number of positions. The number of positions times the grid spacing
then gives the width of the map. Finally the required output type can be selected by clicking on one of the
radio buttons. If an eps output is selected the size of the output must also be specified.
![\includegraphics[scale=0.5]{outflow2.eps}](img915.gif)
![\includegraphics[scale=0.5]{outflow3.eps}](img916.gif)
![\includegraphics[scale=0.4]{tcl_transchange.eps}](img927.gif)